Lesson 1.5 Map and Map Views
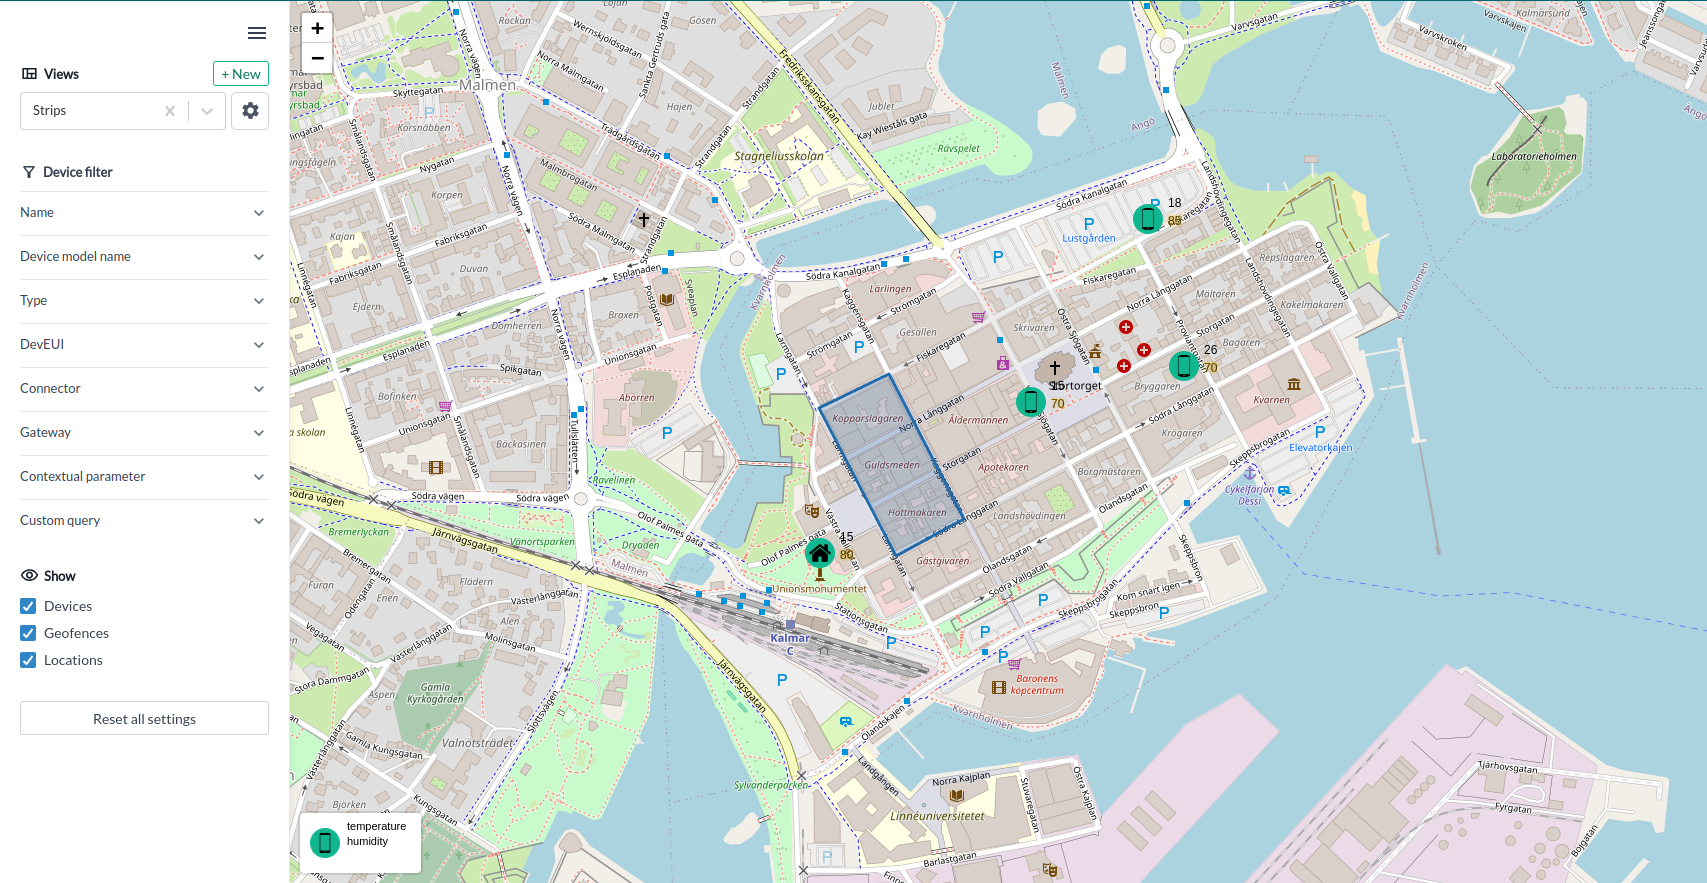
On the Map page you can view the location of your devices on a map.
You can also:
- Filter devices you want to see on the map.
- Show or hide devices, locations and geofences.
- Show color-coded device values next to each device.
- You can select up to three values to show beside the device icon.
- Use thresholds to color-code the values.
- You can star a device value to let the threshold color affect the device icon.
- Set up device values when creating or editing a map view.

- Add or manage views (see map views section).
- Assign a map view to a map widget in a dashboard.
This lesson begins with a step-by-step guide on how to add both non-trackers and tracker devices to the map.
It then explains how to create a signal strength view. After that, it continues with how to add filtering to detect weak signal areas. Finally, it introduces how to create geofences that can be used in tracking use cases.
After the signal strength view section, you will find additional examples on how to set up and configure other types of map views.
Adding Devices to the Map
There are two main types of devices on the map: static devices and trackers. Static devices are placed manually on the map, either during installation or later. Tracker devices update their map position automatically as their physical location changes.
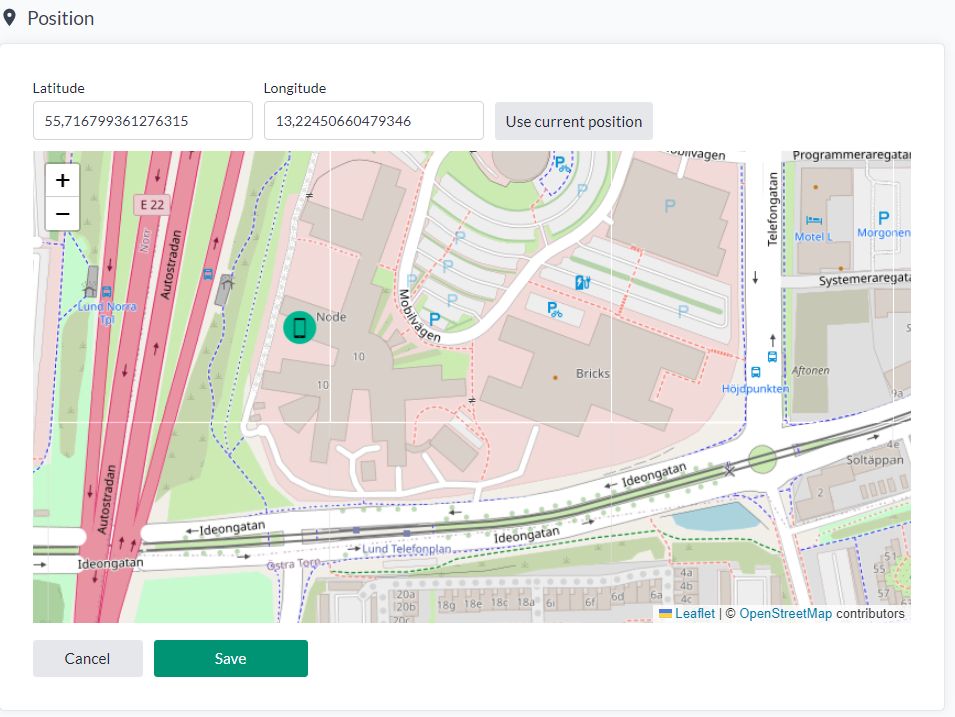
Adding a Non-Tracker Device to the Map
- Go to the Device page in the control panel.
- Click the Position tab in the device sidebar.
- Set the position on the map by clicking directly on the map.
- Click Save to store the device’s location.
Adding a Tracker Device to the Map
Tracker devices generally come in two variants:
-
Trackers that send WGS84 coordinates directly (Latitude/Longitude).
These typically use GPS or Beidou satellite signals for outdoor positioning.
They usually have a battery life of 2–5 years and update their position directly on the map. -
Trackers that rely on a cloud service to resolve their WGS84 location.
These devices are more battery-efficient, often lasting 5–10+ years, depending on how frequently they send lookup requests. They also support indoor positioning.
Positioning can be based on technologies such as GPS, Beidou, WiFi lookup, or BLE lookup.The following cloud location services are currently supported by the platform:
- Traxmate: LoRaWAN Cloud standard localization solution.
- Combain: AI-based localization.
- Combain Indoor: AI-based indoor positioning. Accuracy can be improved through building location surveys. See Lesson 2.8 — Data Flows and Geofences.
- Platform built-in location service for predefined areas with known beacon placements. This is used for the platforms LoRaWAN Mesh solution.
Through the Munin service, AWS Location Service can also be supported.
Enabling Cloud-Supported Location Services
To enable a cloud-based location service for testing, add the translator enable-location-service to your device. This activates the default Traxmate connector (the URL https://lw.traxmate.io must be reachable).
When the platform receives an uplink containing valid GNSS, WiFi, or BLE data, it will request a location lookup through the service.
Note: The default Traxmate connector is API-rate-limited.
For commercial deployments using Traxmate, Combain, or Combain Indoor, please contact your sales representative.
Create a Signal Strength Map View
Step 1 – Filter the devices you want to include
Start by navigating to the Map using the navigation bar. On the left side of the screen, use the available filters to select the devices you want to include in the signal strength view. The filtering works the same way as in the Device List. You may use:
- Parts of the device name
- A contextual parameter
- Any FIWARE Q-based search expression in the Custom Query box (e.g.,
temperature>23)
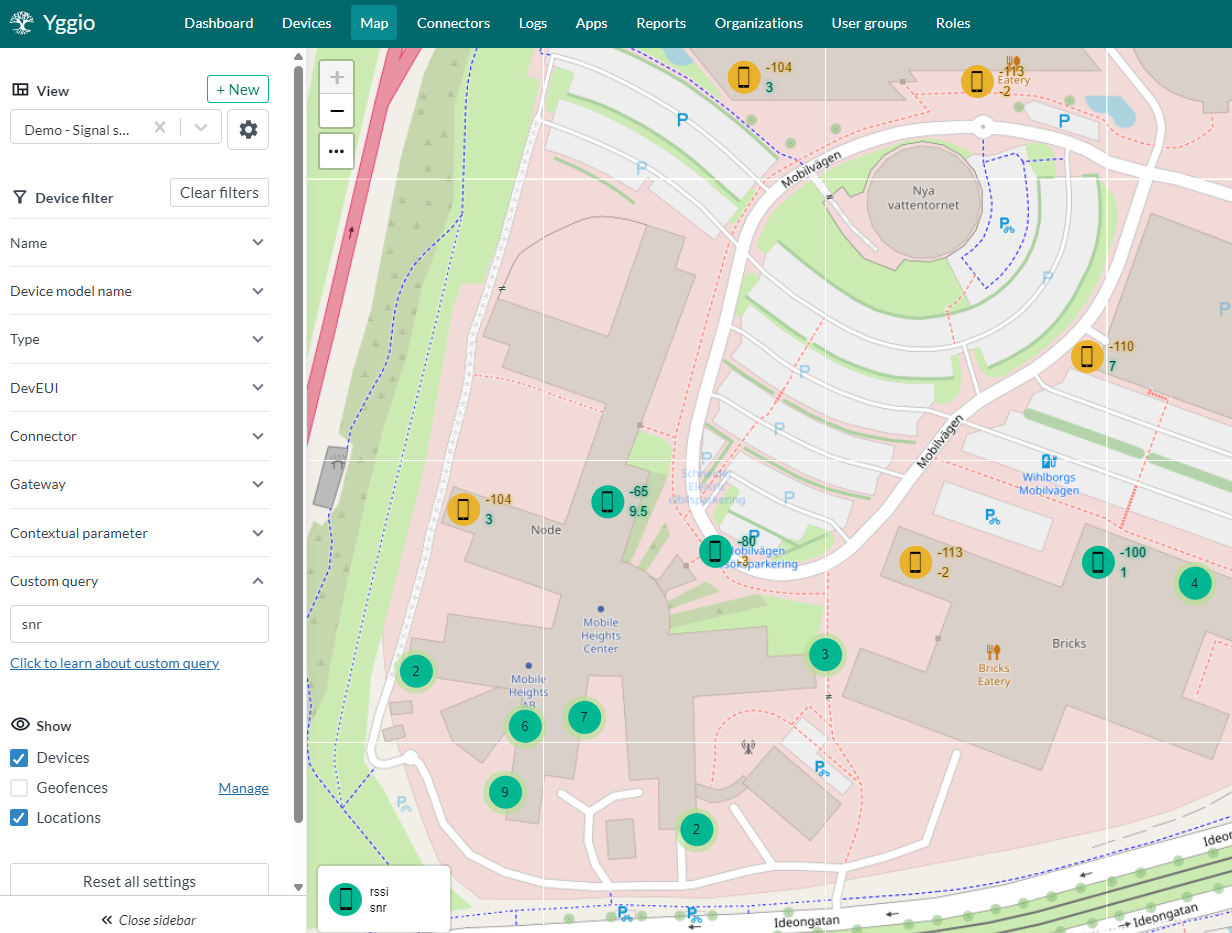
For this lesson, type rssi in the Custom Query search box. This filters the list to only devices that have the key rssi (Relative Signal Strength Indicator) at the root of their data structure (Devices → Device → Data). Most LoRaWAN and NB-IoT devices provide an rssi value.
Step 2 – Zoom in to the area the view should cover
When you create the map view in the next step, it will automatically use the current zoom level and position of the map. Zoom in and center the map around the area you want the view to include.
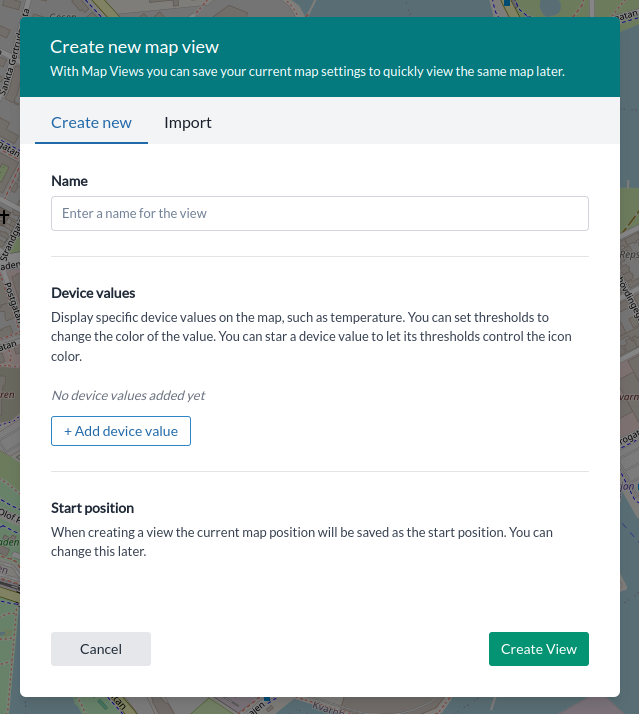
Step 3 – Create the View
- In the sidebar, click the
+ Newbutton.
-
Enter a name for the view.
-
Add the following device values:
-
name – Displays the device name next to its icon.
-
rssi – Displays the device's RSSI (Relative Signal Strength Indicator).
Apply the following color coding:- Less than -116 → Red
- Less than -108 → Yellow
- Greater than -106 → Green
To enter negative values, use the mouse scroll wheel. Once done, click Finished and star the device value.
The star means the device icon will use the color coding from this value.
-
snr – Displays the Signal-to-Noise Ratio (SNR).
Apply the following color coding:- Less than -6 → Red
- Less than -1 → Yellow
- More than -2 → Green
-
These color codes represent typical LoRaWAN signal strength values.
- Click Create to finalize the view.
Step 4 – Selecting a Map View
- Click the
Viewsdropdown menu in the sidebar. - Select the view you want to use.
Tip: Leave the map and come back, then try selecting and unselecting the view to get a feel for how it works.
Step 5 – Modify the View
The rssi and snr values in the view should be interpreted in relation to the Spreading Factor (radio signal modulation) used.
- Lower Spreading Factor → better signal quality and shorter time-on-air when transmitting data.
In LoRaWAN, a color-coded Spreading Factor value could be represented as:
- 7 (best) → Green
- 8 (good) → Green
- 9 (acceptable) → Green
- 10 (low) → Yellow
- 11 (weak) → Red
- 12 (bad) → Red
Note: Spreading Factor significantly affects power consumption.
- A device lasting 10+ years on SF 7–8 may only last 2–3 years on SF 11–12.
- For more details, see the Strips Battery Calculator. Although designed for Strips devices, the principles apply to all LoRaWAN devices.
To modify the view to use Spreading Factor:
- Select the map view.
- Click the cogwheel button.
- Edit the view settings:
- Replace name with spreadingFactor.
- Select the star to use Spreading Factor for the icon color.
- Click Update view to save changes.

Maps in Dashboards
In the next lesson, you will learn how to use your map view in a dashboard.
It’s simple: create a new Map widget and select the map view you want to display.
Geofences
Geofences define a virtual perimeter around a real-world area. Yggio supports both outdoor and indoor geofences with floor level. When a tracker device enters, stays within, or leaves a geofenced area, an event is triggered.
-
To enable geofencing, the tracker must have the Data Flow
generalGeoQueryorgeneralTimerGeoQuery. To process geofence events, forward them to a reference IoT node that uses thegeneral-geofencetranslator.- This enables tracking, visualization, and rules for trackers inside geofenced areas.
- The translator manages enter, inside, and exit events and can also forward events back to the triggering tracker.
-
You can also run a geoquery to identify devices within a geofenced area or an area defined by the geoquery.
For more details about Data Flows see Lesson 2.8 — Data Flows and Geofences.
Creating a Geofence
Step 1 – Create a Reference Node for Geofence Events
Before creating the geofence, create a reference node that will receive geofence events:
- Go to the Device List.
- Create a generic node with a random secret.
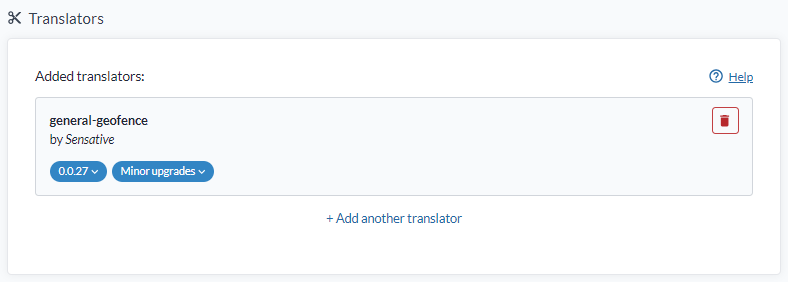
- Add the translator
general-geofenceto the node. - Give it a descriptive name, e.g.,
Geofence-Area-1.
The
general-geofencetranslator provides many features:
- Counts the number of assets and trackers inside the geofence.
- Maintains a list of all devices currently inside.
- Can forward selected data back to the tracker that entered or left the geofence for further data flow logic.
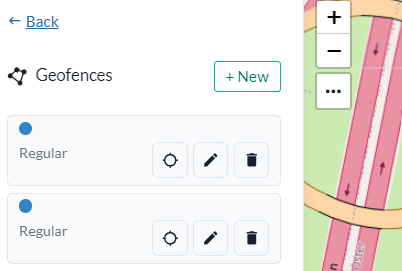
Step 2 – Open the Geofence Manager
- Go back to the Map page.
- Click the Manage button next to Show Geofence in the left panel.

Step 3 – Create a New Geofence
- Click the New button.
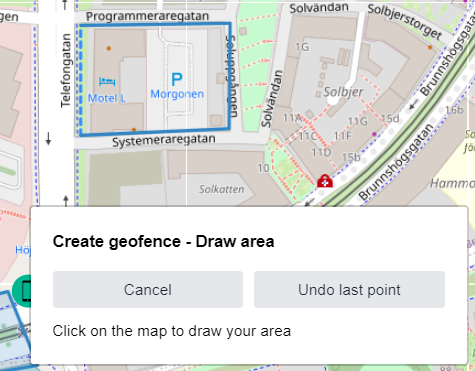
Step 4 – Draw the Geofence
- Click on the map to start drawing your geofence.
- You can remove and redo the last coordinate if needed.
- Close the geofence by connecting the last point back to the start point.
Step 5 – Configure the Geofence
- Click Continue.
- Give the geofence a descriptive name.
- Select the reference node that will receive geofence events.
Step 6 – Visualize Geofence Data
After creating the geofence, you can:
- Create views that visualize the number of assets and trackers inside the geofence.
- Add key geofence KPIs to dashboards.
You can now enjoy state-of-the-art asset tracking using the platform.